Now Reading: How to Build a SOAR Analysis Diagram for a Non-Profit Using AI-Powered Modeling Software
-
01
How to Build a SOAR Analysis Diagram for a Non-Profit Using AI-Powered Modeling Software
How to Build a SOAR Analysis Diagram for a Non-Profit Using AI-Powered Modeling Software
Why a Non-Profit Needed a Clear SOAR Analysis
Sarah works with a non-profit focused on environmental restoration. Her team wants to evaluate their current performance and plan for growth. They need to understand what they’re doing well, where they can grow, what they want to achieve, and how they will measure success.
They don’t have a formal strategic framework. The team spends time in meetings, discussing ideas, but struggles to turn those conversations into a clear, shared picture. That’s when Sarah decided to ask the AI-powered modeling software to build a SOAR analysis diagram.
This wasn’t just about drawing a chart—it was about making the group’s vision visible, structured, and actionable.
The Journey: From Prompt to SOAR Diagram
Sarah started by opening the AI Chatbot and typing:
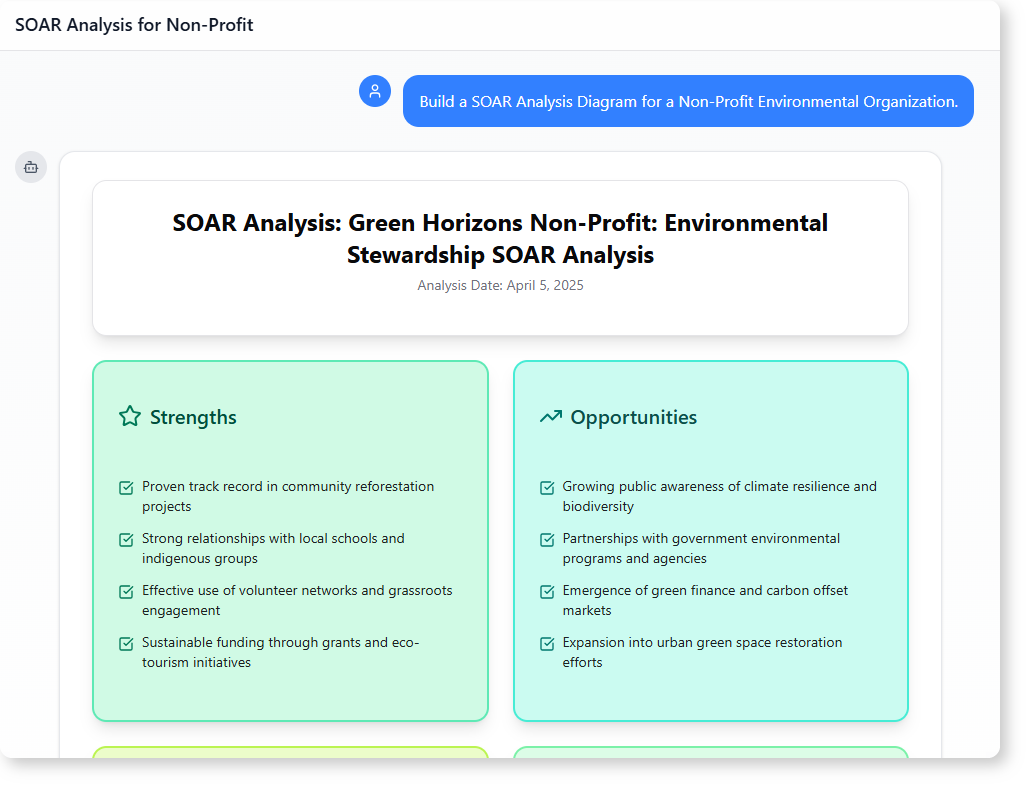
Build a SOAR Analysis Diagram for a Non-Profit Environmental Organization.
The system responded instantly with a structured SOAR diagram tailored to the context of environmental stewardship. The diagram clearly separated the four dimensions: Strengths, Opportunities, Aspirations, and Results.
She then reviewed the output and asked a follow-up question:
Prepare a summary report based on this SOAR Analysis Diagram, highlighting the key strengths, opportunities, aspirations, and results.
The AI generated a concise, readable report that gave the team a unified view of their organization’s current state and future direction.
This wasn’t a one-off. It was a process—simple, repeatable, and grounded in real-world needs.
What the Generated SOAR Diagram Revealed
The SOAR analysis focused on a real-world mission: restoring degraded ecosystems. Here’s what the AI uncovered:
Strengths
- Proven track record in community reforestation projects
- Strong relationships with local schools and indigenous groups
- Effective use of volunteer networks and grassroots engagement
- Sustainable funding through grants and eco-tourism initiatives
Opportunities
- Growing public awareness of climate resilience and biodiversity
- Partnerships with government environmental programs and agencies
- Emergence of green finance and carbon offset markets
- Expansion into urban green space restoration efforts
Aspirations
- Become the leading voice for urban and rural environmental restoration
- Inspire a generation of eco-conscious leaders through education
- Restore 10,000 hectares of degraded ecosystems within 10 years
- Achieve measurable carbon sequestration impact across all projects
Results
- Increase community participation by 50% in the next 12 months
- Achieve 100% project transparency and audit compliance
- Launch 3 new regional restoration programs by 2027
- Secure $2M in new donor funding by end of 2026
The diagram didn’t just list items. It showed cause and effect. For example, strong community ties (a strength) were linked to volunteer engagement (a result), making the plan feel realistic.
Why This Works for Non-Profit Planning
A SOAR analysis helps organizations move beyond vague goals. It turns abstract ambitions into measurable parts.
For a non-profit, this is powerful because:
- It turns conversations into concrete insights
- It helps align staff, donors, and partners
- It provides a shared language for discussion
- It supports fundraising by showing clear progress paths
AI-powered modeling software doesn’t just generate diagrams. It helps interpret real-world challenges and responds with relevant, context-aware content.
How This Process Can Be Used in Practice
You don’t need to be a strategist or a data expert to use this approach. Any organization—non-profit, education, social services—can benefit from a quick SOAR analysis.
Here’s how it might work in your team:
- Open the AI-powered modeling software and describe your organization’s mission.
- Ask the AI to generate a SOAR analysis diagram.
- Review the structure and discuss it with your team.
- Request a summary report to understand the key themes and outcomes.
The prompts are simple. The outputs are clear. No technical skills are needed.
Is This the Right Tool for Your Organization?
If your group is trying to:
- Evaluate current performance
- Identify growth areas
- Set meaningful goals
- Communicate vision clearly
Then an AI-powered modeling software that generates SOAR diagrams is a practical, immediate solution.
It doesn’t replace human judgment. It streamlines the process of turning ideas into structured insights.
Ready to Map Out Your Organization’s Future?
Give our AI-powered modeling software a try at Visual Paradigm’s AI Chatbot today!
Frequently Asked Questions
What is a SOAR analysis and why is it useful?
A SOAR analysis breaks down an organization’s state into four elements: Strengths, Opportunities, Aspirations, and Results. It helps teams see what they’re doing well, where they can grow, what they want to achieve, and how they’ll know success.
Can AI generate a SOAR diagram for non-profits?
Yes. With the right prompts, AI-powered modeling software can create a clear, context-specific SOAR diagram tailored to a non-profit’s mission—like environmental restoration or community education.
Is the SOAR analysis tool only for large organizations?
No. Any group, from small volunteers to large NGOs, can use it. The structure is flexible and designed to fit real-world situations.
How do I know if the AI-generated SOAR analysis reflects my team’s reality?
It’s a starting point. The AI draws from your input and patterns in the prompt. You can refine it by adding more context or adjusting the focus. The output is not final—it’s a conversation starter.

